 iSolution影像分析量測軟體 iSolution影像分析量測軟體
IMT iSolution
|
加拿大IMT公司iSolution影像分析量測軟體是一套科學用分析軟體,
它強大的功能如下 :
Live Measurement and Overlay Settings
Users can perform measurements on the live preview image, using the crosshair or grid masks to center and count. The grid masks include calibration data. Calibration marker (scale bar) can be placed on the live preview image. The marker (scale bar) can also be burned on each captured image automatically. Any standard file format image can be chosen to see it above live preview image.
Calibration (Auto, Manual)
All measurements start with an accurate calibration. Auto, Semi-Auto calibration functions allow the software to calculate the pixels-per-unit value automatically. Only setting the unit for the calibration scale and the distance between the scale marks is needed. This feature greatly improves the accuracy and repetition of measurements. Manual calibrations are easily added and saved for recall from a drop down menu. All calibrations can be saved as files, which let the calibration be retrieved by simply opening the saved files later.
Calibration can be protected by password option. Two password options, one in calibration menu itself and the other in camera resolution option, protect calibration by unexpected change. A scale bar can be permanently added to each image. Scale bar properties for color, size and text are simple to optimize for any image background.
Z-Axis Extended Focus Imaging (EFI), with displacement compensation for stereo microscopes
Samples with curves or of varying heights are difficult to bring into focus under highly magnified conditions. And more a stereomicroscope takes images with tilting due to its own structural characteristics. Thus, each image is out of its supposed position when you move microscope to the Z-axis getting the right focus. Our displacement compensation function allows you to rearrange these images automatically and manually.
Software can combine a stack of images sequentially captured at different levels of focus and combine them into a single in-focus image. You can count on our software not to leave any trace of the composites.
3D Visualization. . . clearly view complex structures
A Three-dimensional picture can be created from any image. The 3-D presentation is based upon intensity values of the image and can be displayed as a normal or wire frame image. Z axis information can easily be adjusted to optimize the 3-D effect. To better visualize an image in 3-D, software offers full 360 degrees of rotation on X-Y-Z axis. A 3D image can then saved in JPG, TIF or BMP format.
Image Stitching. . . create a mosaic of the “Big Picture”
With our software, you can create auto and manual composites of continuously captured images in order to minimize the reduction in the field-of-view that typically comes with increased magnification. Combined images are automatically corrected for brightness without leaving any stitching mark.
Live Image Comparison. . . for fast inspection and size verification
For QA testing or quick go/no-go inspections any stored image can be used as a reference image onto which the live preview image is projected.
Time Lapse Capture and Movie File Production. . . Import into Power Point
Software features a Time Lapse Capture function that supports TIF, BMP and JPG file formats. The Time Lapse Capture function also includes an Auto Save feature by yyyy/mm/dd/hour/minute/second. You can save video movie recordings in AVI, MPG, MPEG, and MOV formats.
Combine Image Planes - Fluorescence Imaging
Merge and pseudo color monochrome images into a single RGB composite.
Advanced - Fluorescence Image merge Fluorescence merging function allows several images to one composite image. There is rich list of pre-defined dyes already. One can choose desired emission wavelength in nanometers also and then correspondent color is calculated automatically
Export Into ExcelR - with one mouse click
A single mouse click exports the original image with measurement, calibration, annotation overlay, measurement data, statistics, and chart.
Manual Measurement Tools - Including Various Perpendicular Distance
Software’s versatile manual measurement features include tools for measuring lengths, areas, and angles and can even auto detect an object's outline and then make specified measurements. The software is equipped with a wide choice of powerful measurement tools including 3-point circle functionality, Npoint circle measurement functionality, parallel line distance measurement, perpendicular distance measurement and object distance measurement. In addition, a zoom-in window can be used to determine the accurate measuring point of an object.
Once you've measured a specimen you can easily export all of the images, measurement data and statistics to an ExcelR file. With i-Solution, comprehensive statistics and data are just one effortless mouse click away.
Line Profiling
Single, multiple, parallel and polyline commands provide Gray/Red/Green/Blue intensity values for specific lines within an image. The profile data of each pixel on the line can be exported to MS Excel.
Auto Trace
Using an automatic edge detection algorithm, our software will perform an auto trace measurement function around a closed object. This function greatly increases accuracy and saves time when making measurements of complex shapes.
Image Processing
Manual Brightness, Contrast, Gamma, Background Subtraction, Shading Correction, Histogram, Clone, Crop, AOI, Resize, Rotate, Split, Merge Monochrome series into RGB Color, Combine different exposure Images for highlight reduction, Image Mode Change, Grayscale, RGB, HSB, YUV Pseudo Color view, Full range of enhancement and morphology filters 8bit and 16bit per channel Manual Measurements Point Count, Straight Line, Circle by radius, Circle by N points, Circle by diameter, Circle by 3 points, rectangle, polygon, polyline, splice lines from a common point, auto trace, angle parallel lines, perpendicular width, perpendicular from common line, angle between 2 lines, distance, perpendicular distance.
Shading Correction
The edge parts of captured image by low magnification have background shading frequently, which can be removed by the shading correction function. The color of the original image remains the same though. A standard image is acquired from a blank space on the slide glass, or from an out of focus image in a metallurgical specimen. Such a standard image is used to correct the background shading of all other captured images.
Annotation
Line, arrow, polyline, spline, rectangle, ellipse, text
Region of Interest- ROI. . . . with unique add/subtract capability
Rectangle, arbitrary rectangle, circle, arbitrary ellipse, polyline, spline, magic wand ROI itself can be saved to work with other images. The saved ROI can be placed on the exact same location of other images.
View and Zoom Image
Manual zoom In-Out, User Defined, Fit to Window, 1600% Zoom in Window for Accurate Edge Detect, sizeable context Window to view all open Images
Image Editing
Undo, Redo, Copy, Paste, Paste New, Delete, Delete All, Annotate, Image Information
Save Options
TXT File Format, image and measurement data together in Proprietary .img File Format for future editing and data collection
Supported Image File Formats
jpg, jpeg, tif, tiff, bmp, gif, pcx, tga, mpg, mpeg, avi, mov, img, rpt, txt and etc.
Report Generator
Create Report, Insert Image and Data, Insert other OLE Objects
Window View
Split Horizontal, Split Vertical, Cascade, Tile Horizontal, Tile Vertical, Arrange icons, Dynamic User Interface (UI), Classic, Modern
Time Lapse Sequence Control
Play Forward, Backward, Making Movie File (mpg, avi, mov) with Still Images, Split Single Image from Sequence File
Auto/Manual Thresholding for Count and Size
Intensity and color based thresholding tools for identifying, counting and categorizing objects. Ideal for automatic objects counting and percentage of area measurements.
Objects Editing… enhanced measurement accuracy!
Target threshold objects can be edited by all measurement parameters or with filters to clean, close, open, dilate, erode, automatic separate and fill holes.
Densitometry
i-Solution software automatically calculates Optical Density (OD) by absolute and relative figures, semi automatically, or manually based on user configuration. Images and OD figures can then be exported directly to an MS PowerPoint file.
Perfect Focus Enhancement
i-Solution implements a perfect function of focus compensation irrespective of the status of lights and specimen.
Macro-Enabled Recording
Create and save customized measurement settings and sequences Data Collector Select desired measurements then easily collect and tabulate data from multiple samples.
Reflected Light Subtraction
i-Solution creates clear, evenly illuminated images by removing the bright saturated light from a highly reflective sample.
Automatic count for live and stained cells
Conglomerated live and stained cells are separated automatically and counted.
Particle Analysis Particle data in many images is given by statistics and individual form. Each object is viewed with data together.
Phase Analysis & Advanced Threshold
i-Solution conducts phase analysis on an entire image or within a specified Region of Interest (ROI) and it can allow to sort images using Gray Scale, RGB, HSB or YUV.
Thickness Measurement (Layer Depth Measurement)
Average thickness is measured automatically by defining box. The number of scan lines can be defined by users.
Stereometry for Biovolume
The 3D volume of an object is calculated by using 2D measuring parameters.
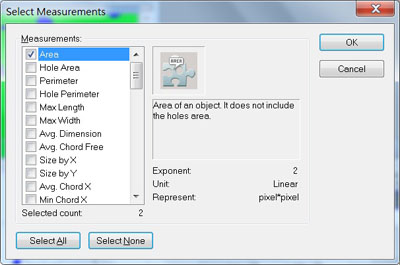
46 selectable measurement parameters
A complete menu of measurement types with a description of the parameter
Illuminator control
Program controls illuminator shutter.
Live cell count
Live cells having irregular shape can be counted automatically, which can be hardly possible by ordinary thresholding method.
|